Grand Prix
Motor racing: turbo boosts, nitro and a pit-lane challenge
- Fractions, Decimals and Percentages
- Percentages
- Fractions
3 laps · about 4 min
See how Prep4All works
A 5-minute film for parents
The Prep4All library
Every resource, with short videos
Lessons
Structured lessons & exercises — free samples
Fun Lessons
Interactive & engaging lessons
Vocabulary
Build your word power
Creative Writing
Prompts, techniques & games
Comprehension
Passages, skills & mock papers
Flash Cards
Quick revision cards
Knowledge Nuggets
Bite-sized learning tips
11+ Syllabus Hub
Every topic & question type explained
11+ Subjects
Explore all subjects
Grammar Schools
School guides & information
Find Schools Near You
Nearest grammar schools by postcode
11+ Key Dates
Registration, test & apply-by dates
11+ Pass Marks
Qualifying scores by county
Readiness Quiz
Is your child ready? 2-min check
11+ Prep Guide
Complete preparation guide
FSCE Hub
Complete FSCE syllabus, schools & practice
FSCE Exam Guide
Exam preparation guide
ISEB Pre-Test Hub
Format, scoring, sections & preparation
ISEB Exam Guide
The Pre-Test explained for parents
ISEB Schools
Which schools use the Pre-Test — verified
Blog
Articles & expert tips
Contact Us
Get in touch with us
Join WhatsApp
Join our community group
Run the giant scoreboard at a championship athletics meet. Each right answer posts a result: the big screen flips, a medal drops in and a wave of lights sweeps the stands.
Included in every Prep4All plan. Grand Prix is free to try first.
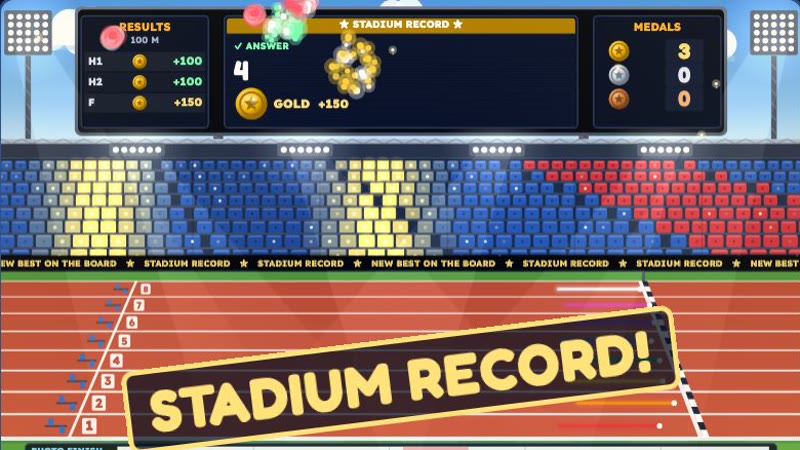
Stadium Statistician puts your child in charge of the giant scoreboard at a championship athletics meet. A round is 13 questions across four events: the 100 m sprint, the long jump, the javelin and the Relay Final, which has one leg for each topic. Each right answer posts a result with a gold, silver or bronze medal, depending on how quickly it came.
A wrong answer goes to a stewards’ enquiry: no medal, and the game explains the trap. The rank depends only on right answers, so accuracy counts for more than speed. Questions get harder after three right in a row and easier after two misses in a row, and the meet review at the end works through every trap with a worked explanation.
Questions from the game, for you to try together. Have a go before opening the answer.
Which would be the best chart or graph to record the colour of each car as it drives past the school?
Tally chart — A tally chart records things as you count them.
The probability that a bus is on time is 0.22. What is the probability that the bus is not on time?
0.78 — 1 − 0.22 = 0.78.
Omar’s scores in his first four tests were 7, 3, 10 and 5. What must he score in the fifth test to make his mean score exactly 9?
20 — 5 tests with a mean of 9 need a total of 5 × 9 = 45. So far: 25. 45 − 25 = 20.
Motor racing: turbo boosts, nitro and a pit-lane challenge
Orbital construction: core, habitat, observatory and a meteor shower
Treasure map: four regions under the fog and the final dig
Every game, every level and the daily challenge are included in every Prep4All plan, with lessons, practice tests and mock exams. Every plan starts with a 7-day free trial.